Nonlinear Self-focusing
This BeamLab demo shows a high-power Gaussian beam incident on a block of fused silica where it then converges to a small spot due to the self-focusing effect by taking into account the nonlinear change of the intensity-dependent refractive index.
BeamLab demo: selffocusing.m
The following video shows how the intensity distribution changes along the propagation distance z. The left figure shows the two-dimensional intensity distribution I(x,y) normalized to the input intensity and displayed on linear scale. The right figure shows a three-dimensional view of the intensity dependent nonlinear refractive index.
Video of intensity profile (left) and refractive index (right)
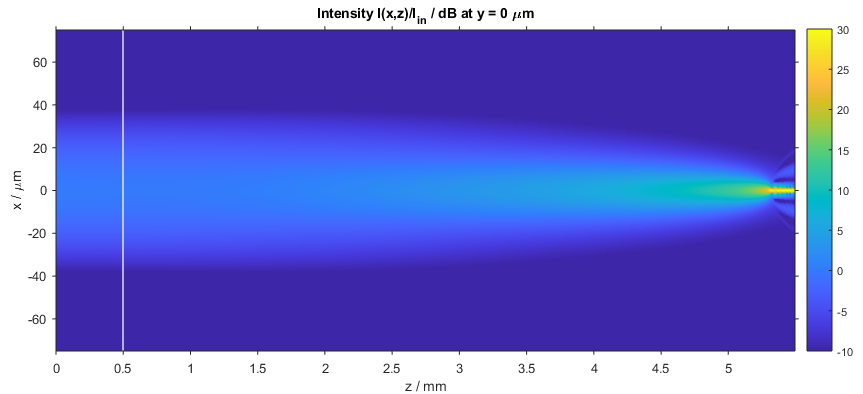
After the calculation has finished, the intensity distribution as a function of propagation distance z is plotted. The figure below depicts the intensity distribution I(x,z) at y = 0 µm. The white line indicates the start of the block of fused silica.

Intensity distribution of the self-focusing Gaussian beam (x–z slice)
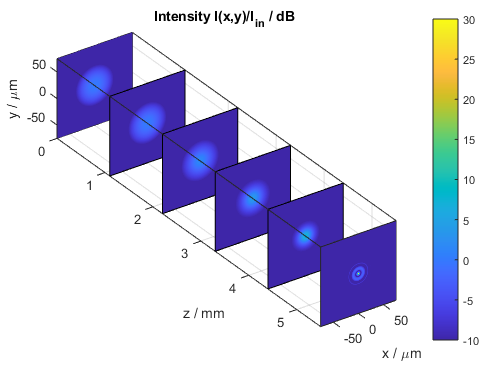
The following figure shows a compact three-dimensional view of stacked plots, each portraying the intensity distribution I(x,y) at different distances z.

Intensity distribution of the self-focusing Gaussian beam (stacked x–y slices)
About BeamLab
BeamLab is an award-winning set of simulation tools for beam propagation through optical devices and waveguides in your familiar MATLAB® environment. It offers a high flexibility in waveguide design and post-processing of any output data.

